Hey all :)
I’ve finally managed to release heaptrack properly! The first stable release, i.e. v1.0.0 is available for download: https://download.kde.org/stable/heaptrack/1.0.0/src/
You can find more information on the official release announcement over on the KDAB page: https://www.kdab.com/heaptrack-v1-0-0-release/
If you want to read more about what heaptrack is, check out the README.md or have a look at the initial announcement of heaptrack, now three years old!
Cheers, happy profiling!
continue reading...
Hello all!
I have the pleasure to attend Akademy this year again. From my past experience, I’m really looking forward to have a good time again. Lots of hacking, meeting known and unknown faces, drinking beer and socializing ahead! I also love that it’s in a (to me) new country again, and wonder what I will see of the Czech Republic and Brno!
This year, the conference schedule is a bit different from the past years. Not only do we have the usual two days packed with interesting talks and keynotes. No - this year there will also be workshops on the third day! These are more in-depth talks which hopefully teach the audience some new skills, be it QML, mobile development, testing, or … profiling :) Your’s truly has the honor to hold a one-hour Profiling 101 workshop.
continue reading...
Hello everyone,
with a tingly feeling in my belly, I’m happy to announce heaptrack, a heap memory profiler for Linux. Over the last couple of months I’ve worked on this new tool in my free time. What started as a “what if” experiment quickly became such a promising tool that I couldn’t stop working on it, at the cost of neglecting my physics masters thesis (who needs that anyways, eh?). In the following, I’ll show you how to use this tool, and why you should start using it.
A faster Massif?
Massif, from the Valgrind suite, is an invaluable tool for me. Paired with my Massif-Visualizer, I found and fixed many problems in applications that lead to excessive heap memory consumption. There are some issues with Massif though:
- It is relatively slow. Especially on multi-threaded applications the overhead is large, as Valgrind serializes the code execution. In the end, this sometimes prevents one from using Massif altogether, as running an application for hours is unpractical. I know that we at KDAB sometimes had to resort to over-night or even over-weekend Massif sessions in the hope to analyze elusive heap memory consumption issues.
- It is not easy to use. Sure, running
valgrind --tool=massif <your app> is simple, but most of the time, the resulting data will be too coarse. Frequently, one has to play around to find the correct parameters to pass to --depth, --detailed-freq and --max-snapshots. Paired with the above, this is cumbersome. Oh and don’t forget to pass --smc-check=all-non-file when your application uses a JIT engine internally. Forget that, and your Massif session will abort eventually. - The output is only written at the end. When you try to debug an issue that takes a long time to show up, it would be useful to regularly inspect the current Massif data. Maybe the problem is already apparent and we can stop the debug session? With Massif, this is not an option, as it only writes the output data at the end, when the debugee stops.
continue reading...
As I just wrote in another article, Massif is an invaluable tool. The [Visualizer](https://projects.kde.org/massif-visualizer] I wrote is well appreciated and widely used as far as I can see.
A few days ago though, I did a very long (~16h) Massif run on an application, which resulted in a 204MB massif.out data file. This proved to be a very good stress test for my visualizer, which triggered me to spent some time on optimizing it. The results are pretty nice I thing, so look forward to Massif-Visualizer 0.4:
Reduced Memory Consumption
Yeah, meta eh? Just how I like it! I’ve used Massif to improve the memory consumption of Massif-Visualizer, and analyzed the data in the Visualizer of course… :)
Initial Version

fig. 1: initial memory consumption of the visualizer
continue reading...
Massif is a really nifty tool which is very powerful, especially paired with my visualizer. The caveat of course is that it slows down the application considerably, I’ve seen anything up to a factor of 100… I see no alternative to Massif when it comes to investigating where your memory problems come from. But if you just want to see whether you have a problem at all, tracking the total memory consumption should suffice.
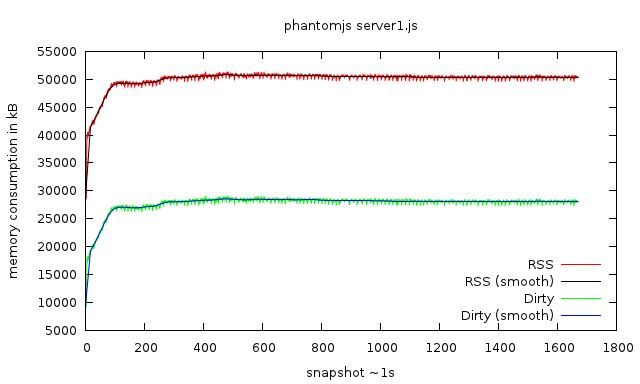
A few days ago, I came across pmap on Stack Overflow, which makes it easy to track the RSS memory consumption of an application using the -x switch. Of course I had to write some bash magic to automate this process and visualize the data using Gnuplot! Behold:

memory consumption of a PhantomJS script over ~30min
continue reading...
Hey all,
been some time since I blogged last time. My TODO list is ever increasing and I took my day job at KDAB up again. Among others, I attended a marketing talk by Edmund Preiss. He actually made that marketing talk interesting, not least by his huge knowledge in the business, thanks to ~20 years of working for Intel. Probably the most important info I got out of it is this:
VTune is available free-of-charge under a non-commercial license
Yes, you heard right. Take these links:
note this entry from the FAQ:
What does noncommercial mean?
Non-commercial means that you are not getting compensated in any form for the products and/or services you develop using these Intel® Software Products.
continue reading...
Hey all,
I’d like to have some feedback from you. Consider this code:
    #include <iostream>
    #include <memory.h>

    using namespace std;

    struct List {
        List(int size) {
            begin = new int[size];
            memset(begin, 0, size);
            end = begin + size;
        }
        ~List() {
            delete[] begin;
        }
        int at(int i) const {
            return begin[i];
        }
        int size() const {
    //         std::cout << "size called" << std::endl;
            return end - begin;
        }
        int& operator[](int i) {
            return begin[i];
        }

    private:
        int* begin;
        int* end;
    };

    int main() {
        const int s = 1000000;
        for (int reps = 0; reps < 1000; ++reps) {
            List l(s);
            List l2(s);
            // version 1
            for ( int i = 0; i < l.size(); ++i ) {
            // version 2
    //         for ( int i = 0, c = l.size(); i < c; ++i ) {
                l2[i] = l.at(i);;
            }
        }
        return 0;
    }
continue reading...
Just a quick status update: Massif Visualizer now reacts on user input. Meaning: You can click on the graph and the corresponding item in the treeview gets selected and vice versa. It’s a bit buggy since KDChart is not reliable on what it reports, but it works quite well already.
Furthermore the colors should be better now, peaks are labeled (better readable on bright color schemes, I’m afraid to say…), legend is shown, …
Now lets see how I can make the treeview more useful!
continue reading...
I just need to get this out quickly:
We were aware that KDevelop’s CMake support was slow. Too slow actually. It was profiled months ago and after a quick look that turned up QRegExp, it was discarded in fear of having to rewrite the whole parser properly, without using QRegExp. Which btw. is still a good idea of course.
But well, today I felt like I should do some more tinkering. I mean I managed to optimize KDevelop’s Cpp support recently (parsing Boost’s huge generated template headers, like e.g. vector200.hpp is now 30% faster). I managed to make KGraphViewer usable for huge callgraphs I produce in Massif Visualizer. So how hard could it be to make KDevelop’s CMake at least /a bit/ faster, he?
Yeah well an hour later and two commits later, I managed to find and fix two bottlenecks. Both where related to QRegExp. Neither was the actual parser, instead it was the part that evaluated CMake files, esp. the STRING(...) function. So even if we’d used a proper parser generator, this would still been slow.
continue reading...
Hey everyone!
I just committed an (imo) insanely useful feature for KCacheGrind: Transparent loading of compressed Callgrind files. Finally one does not have to keep those Callgrind files around uncompressed, hogging up lots of space. And what is even more important: It’s much easier to share these files now, as you can send or upload them as .gz or better yet .bz2 and open them directly. KDE architecture just rocks :) So in KDE 4.5 the best profiling visualizer just got better :D
In related news: I’m spending my time as intern at KDAB currently by creating an application to visualize Massif. If you are interested, check the sources out on gitorious: http://gitorious.org/massif-visualizer
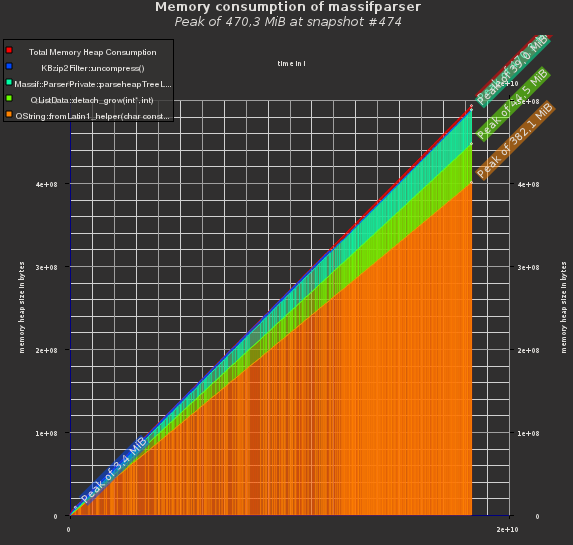
It’s still pretty limited in what it offers, yet is probably already more useful than the plain ASCII graph that ms_print generates:
Visualization of a Massif output file
This is very WIP but the visuals are somewhat working now. I plan to make the whole graph react on user input, i.e. zoomable, click to show details about snapshots, show information about the heap items that make up the stacked part of the diagram, …
continue reading...


