Hey all :)
I’ve finally managed to release heaptrack properly! The first stable release, i.e. v1.0.0 is available for download: https://download.kde.org/stable/heaptrack/1.0.0/src/
You can find more information on the official release announcement over on the KDAB page: https://www.kdab.com/heaptrack-v1-0-0-release/
If you want to read more about what heaptrack is, check out the README.md or have a look at the initial announcement of heaptrack, now three years old!
Cheers, happy profiling!
continue reading...
Hello everyone,
with a tingly feeling in my belly, I’m happy to announce heaptrack, a heap memory profiler for Linux. Over the last couple of months I’ve worked on this new tool in my free time. What started as a “what if” experiment quickly became such a promising tool that I couldn’t stop working on it, at the cost of neglecting my physics masters thesis (who needs that anyways, eh?). In the following, I’ll show you how to use this tool, and why you should start using it.
A faster Massif?
Massif, from the Valgrind suite, is an invaluable tool for me. Paired with my Massif-Visualizer, I found and fixed many problems in applications that lead to excessive heap memory consumption. There are some issues with Massif though:
- It is relatively slow. Especially on multi-threaded applications the overhead is large, as Valgrind serializes the code execution. In the end, this sometimes prevents one from using Massif altogether, as running an application for hours is unpractical. I know that we at KDAB sometimes had to resort to over-night or even over-weekend Massif sessions in the hope to analyze elusive heap memory consumption issues.
- It is not easy to use. Sure, running
valgrind --tool=massif <your app> is simple, but most of the time, the resulting data will be too coarse. Frequently, one has to play around to find the correct parameters to pass to --depth, --detailed-freq and --max-snapshots. Paired with the above, this is cumbersome. Oh and don’t forget to pass --smc-check=all-non-file when your application uses a JIT engine internally. Forget that, and your Massif session will abort eventually. - The output is only written at the end. When you try to debug an issue that takes a long time to show up, it would be useful to regularly inspect the current Massif data. Maybe the problem is already apparent and we can stop the debug session? With Massif, this is not an option, as it only writes the output data at the end, when the debugee stops.
continue reading...
Hello everyone!
Finally I take some time to blog again. I’m currently in Vienna for the joint KDevelop/Kate sprint together with lots of other hackers. Many thanks to Joseph for planning and partially financing this sprint! And of course as usual many thanks to the KDE e.V. and all the donors for bringing in the rest of the money required to pull something like this off!
Anyhow, considering that the sprint is running since Tuesday, I need to catch up quite a bit… Actually, I have to start even before that since I committed something quite noteworthy in KDevelop and KMail last week.
Reducing Memory Consumption
KMail
Shared Data References
I attended the recent Akonadi sprint that took place at the KDAB office in Berlin (where I work btw.). I heard that Alex Fiestas would come and show us his memory problems in KMail, which sooner or later was eating multiple GBs of memory for him. That sounded like a fun task to improve, fixing performance issues is what I love to do :) So I investigated it with Valgrind/Massif and my pmap script. After quite some time I came up with a patch to fix the memory increase, which is waiting for Stephen Kelly to review. It should be merged into master very soon™.
continue reading...
As I just wrote in another article, Massif is an invaluable tool. The [Visualizer](https://projects.kde.org/massif-visualizer] I wrote is well appreciated and widely used as far as I can see.
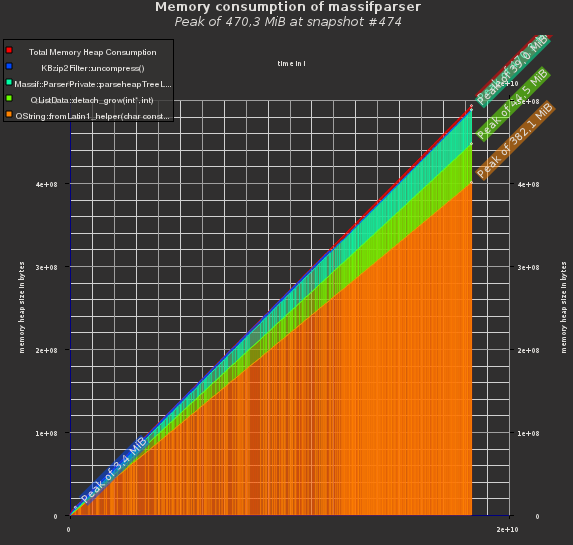
A few days ago though, I did a very long (~16h) Massif run on an application, which resulted in a 204MB massif.out data file. This proved to be a very good stress test for my visualizer, which triggered me to spent some time on optimizing it. The results are pretty nice I thing, so look forward to Massif-Visualizer 0.4:
Reduced Memory Consumption
Yeah, meta eh? Just how I like it! I’ve used Massif to improve the memory consumption of Massif-Visualizer, and analyzed the data in the Visualizer of course… :)
Initial Version

fig. 1: initial memory consumption of the visualizer
continue reading...
Massif is a really nifty tool which is very powerful, especially paired with my visualizer. The caveat of course is that it slows down the application considerably, I’ve seen anything up to a factor of 100… I see no alternative to Massif when it comes to investigating where your memory problems come from. But if you just want to see whether you have a problem at all, tracking the total memory consumption should suffice.
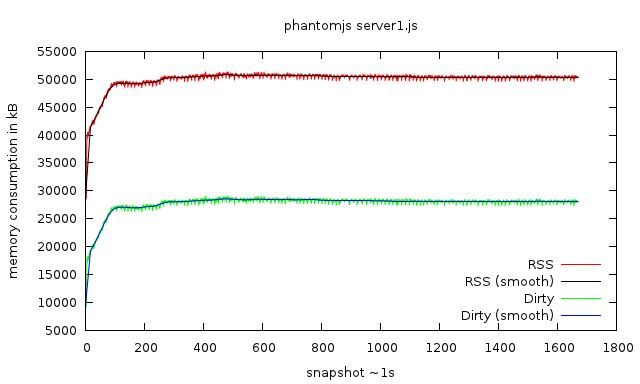
A few days ago, I came across pmap on Stack Overflow, which makes it easy to track the RSS memory consumption of an application using the -x switch. Of course I had to write some bash magic to automate this process and visualize the data using Gnuplot! Behold:

memory consumption of a PhantomJS script over ~30min
continue reading...


