Tracking Memory Consumption Using Pmap
Massif is a really nifty tool which is very powerful, especially paired with my visualizer. The caveat of course is that it slows down the application considerably, I’ve seen anything up to a factor of 100… I see no alternative to Massif when it comes to investigating where your memory problems come from. But if you just want to see whether you have a problem at all, tracking the total memory consumption should suffice.
A few days ago, I came across pmap on Stack Overflow, which makes it easy to track the RSS memory consumption of an application using the -x switch. Of course I had to write some bash magic to automate this process and visualize the data using Gnuplot! Behold:
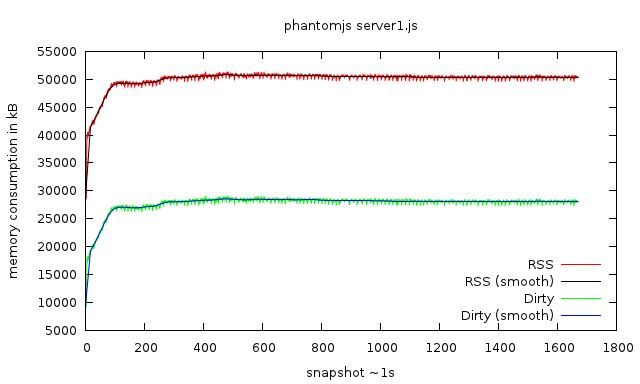
memory consumption of a PhantomJS script over ~30min
usage
It’s simple, really: track_memory.sh $(pidof myapp).
The default timeout is ~1s between snapshots, you can pass a different timeout as second parameter. Bash’s sleep can also take float numbers such as 0.1 to get more snapshots for fast-running apps.
You can also run show_memory.sh mem.log.$(pidof myapp) while you are still tracking the memory. The gnuplot window that appears allows you to update the data intermittently, to zoom in and to create images such as the above.
Note: This kind of memory usage tracking costs nearly nothing, your application continues to work at full speed. Also be aware that this just shows the RSS memory consumption. Massif will always give you better, more detailed and accurate results. Still, I think this should already give you an idea on how your application behaves. If the graph goes up and up, you probably got a memory leak! Then it’s time to run Memcheck and/or Massif to find the issue and fix it!
track_memory.sh
You can find the most-recent version on GitHub: https://github.com/milianw/shell-helpers/blob/master/track_memory.sh
    #!/bin/bash

    #
    # track memory of given application, identified by PID,
    # using pmap -x, to show RSS and Dirty memory usage.
    #
    # visualization can later on be done with the
    # show_memory.sh script.
    #

    pid=$1
    sleep=$2;

    if [[ "$sleep" == "" ]]; then
      sleep=1
    fi

    if [[ "$(ps -p $pid | grep $pid)" == "" ]]; then
      echo "cannot find program with pid $pid"
      echo "track_memory.sh PID [SLEEP_TIMEOUT]"
      echo
      echo "example: track_memory.sh \$(pidof someapp) 0.1"
      exit
    fi

    logfile=mem.log.$pid

    echo "# $(ps -o command= -p $pid)" > $logfile
    echo "# $sleep" >> $logfile

    cat $logfile

    while [[ "$(ps -p $pid | grep $pid)" != "" ]]; do
      echo "snapshot " $pid
      pmap -x $pid | tail -n1 >> $logfile
      echo "$sleep"
      sleep $sleep;
    done

    echo "done tracking, visualizing"
    $(dirname $0)/show_memory.sh "$logfile"
show_memory.sh
You can find the most-recent version on GitHub: https://github.com/milianw/shell-helpers/blob/master/show_memory.sh
    #!/bin/bash

    #
    # visualize memory consumption over time
    # as recorded by pmap / track_memory.sh
    # script
    #

    logfile=$1

    if [ ! -f "$logfile" ]; then
      echo "cannot find memory logfile: $1"
      echo
      echo "usage: show_memory.sh LOGFILE"
      echo
      echo "example: show_memory.sh mem.log.12345"
      exit
    fi

    title=$(head -n1 "$logfile")
    timeout=$(head -n2 "$logfile" | tail -n1)

    title=${title/\# /}
    timeout=${timeout/\# /}

    # total:
    #  '$logfile' using 3 w lines title 'Kbytes', \

    gnuplot -p -e "
    set title '$title';
    set xlabel 'snapshot ~${timeout}s';
    set ylabel 'memory consumption in kB';
    set key bottom right;
    plot \
      '$logfile' using 4 w lines title 'RSS' lt 1, \
      '$logfile' using 4 smooth bezier w lines title 'RSS (smooth)' lt 7, \
      '$logfile' using 5 w lines title 'Dirty' lt 2, \
      '$logfile' using 5 smooth bezier w lines title 'Dirty (smooth)' lt 3;
    ";
Future
The above is nice, but I’m wondering on whether one should not add this kind of utility to ksysguard: It already allows you to track the total memory consumption of your system, yet I did not find a way to just track a single application and visualize it’s memory consumption.
Comments
Want to comment? Send me an email!
Comment by Ritesh Raj Sarraf (not verified) (2012-04-13 10:01:00)
Yes, please. These should be integrated.
Comment by Anonymity is great (not verified) (2012-03-19 14:08:00)
Nice scripts. I totally agree with you that this should be part of ksysguard. This would definitely increase the awesomeness of ksysguard.