Heaptrack - A Heap Memory Profiler for Linux
Hello everyone,
with a tingly feeling in my belly, I’m happy to announce heaptrack, a heap memory profiler for Linux. Over the last couple of months I’ve worked on this new tool in my free time. What started as a “what if” experiment quickly became such a promising tool that I couldn’t stop working on it, at the cost of neglecting my physics masters thesis (who needs that anyways, eh?). In the following, I’ll show you how to use this tool, and why you should start using it.
A faster Massif?
Massif, from the Valgrind suite, is an invaluable tool for me. Paired with my Massif-Visualizer, I found and fixed many problems in applications that lead to excessive heap memory consumption. There are some issues with Massif though:
- It is relatively slow. Especially on multi-threaded applications the overhead is large, as Valgrind serializes the code execution. In the end, this sometimes prevents one from using Massif altogether, as running an application for hours is unpractical. I know that we at KDAB sometimes had to resort to over-night or even over-weekend Massif sessions in the hope to analyze elusive heap memory consumption issues.
- It is not easy to use. Sure, running
valgrind --tool=massif <your app>is simple, but most of the time, the resulting data will be too coarse. Frequently, one has to play around to find the correct parameters to pass to--depth,--detailed-freqand--max-snapshots. Paired with the above, this is cumbersome. Oh and don’t forget to pass--smc-check=all-non-filewhen your application uses a JIT engine internally. Forget that, and your Massif session will abort eventually. - The output is only written at the end. When you try to debug an issue that takes a long time to show up, it would be useful to regularly inspect the current Massif data. Maybe the problem is already apparent and we can stop the debug session? With Massif, this is not an option, as it only writes the output data at the end, when the debugee stops.
With these issues in mind, I often wondered whether there isn’t a better alternative. To track the heap memory consumption, all we need to track are the calls to the allocation functions like malloc and free. The rest of what Valgrind is doing is not required, so shouldn’t it be possible to write a custom tracker with the help of the LD_PRELOAD trick which solves the issues above? But we need to get backtraces, and that quickly, as malloc & friends are often called extremely often. How is that possible?
The Shoulders of Giants
For a long time, I did not know any solution to the backtrace problem. But early this year, a colleague of mine told me that vogl also uses the LD_PRELOAD trick to overload the OpenGL functions and has the ability to grab backtraces. Apparently it was also quite efficient, so I had a look at what its doing and indeed, there I found my holy grail: libunwind, paired with a patched libbacktrace and some (to me) esoteric Linux C APIs. Combined, this makes it possible to efficiently grab backtraces with libunwind and delay the DWARF debug symbol interpretation until a later time. Without the example code in vogl, I’d never come up with this - so many thanks to Valve for releasing the source code on GitHub!
Introducing heaptrack
From here on, the rest was mostly plumbing. heaptrack consists of five parts:
libheaptrack_preload.so: The shared library that is injected into the debugee application using theLD_PRELOADtrick. It overloadsmalloc& friends, grabs a backtrace of raw instruction pointers withunw_backtraceand writes it all to file specified via theDUMP_HEAPTRACK_OUTPUTenvironment variable. Additionally,dlopenanddlcloseare overwritten and trigger the collection of runtime information on shared libraries, which is required to later translate the instruction pointer addresses with DWARF debug information. Finally, a timer is also started with allows us to correlate allocations and memory consumption with real time.libheaptrack_inject.so: Similar to the preload variant, this library is used for runtime-attachement to an existing process. Frequently, I found myself wondering why suddenly an application’s heap memory consumption increases. Neither massif, nor any other tool I know of, can do runtime-attaching, but heaptrack can now do this!heaptrack_interpret: This process reads the output oflibheaptrack.sooverstdinand annotates the instruction pointer addresses with DWARF debug symbols with the help oflibbacktrace. The annotated data stream is then sent tostdout. I recommendgzip‘ing it to save some disk space, as the data files can easily consume hundreds of megabytes otherwise. The resulting data file is then “final”, meaning you can transfer it to any other machine as no further processing is required that is machine dependent.heaptrack: To simplify the process, there is a small shell script which combines the first two tools. It launches the arguments passed to it as a process with the correctLD_PRELOADenvironment. The output oflibheaptrack.sois directly transmitted to aheaptrack_interpretprocess with the help ofmkfifo. And theheaptrack_interpretoutput finally is compressed on the fly and stored to disk. This is the tool you want to use:$ heaptrack yourapp [your arguments...] starting application, this might take some time... output will be written to /home/milian/heaptrack.yourapp.12345.gz ... Heaptrack finished! Now run the following to investigate the data: heaptrack_print /home/milian/heaptrack.yourapp.12345.gz | lessheaptrack_print: Similar toms_print, this process analyzes the output ofheaptrack_interpret. It has many features, which I’ll outline below. You can run it at any time on the output file thatheaptrackcreates, and it supports transparent decompression ofgzip‘ed files. The output is written directly to the CLI, which is often cumbersome to interpret. I plan to work on a properheaptrack-visualizerin the future.
The temporary file format of the libheaptrack.so output, as well as the permanent one by heaptrack_interpreted is currently undocumented. It’s plain text though and should be easy to decipher, esp. with the source code at hand.
Note that heaptrack, contrary to Massif, does not do any aggregation of the data. It only minimizes the data files by not printing the same backtrace information repeatedly. But each individual malloc or free call, together with the function arguments, will be tracked. This allows some extremely interesting insights into the heap usage of a debugee, as we can later analyze the data to find all of the following:
- heap memory consumption: this is what Massif does, and often the most interesting
- number of calls to allocation functions: usually you’d need a profiler like Valgrinds
callgrindto figure out where you frequently allocate memory. Heaptrack gives you that information as well, and much quicker. I used this data already in many places to get rid of temporary memory allocations. This is extremely worthwhile, as not only are memory allocations relatively slow, your performance also benefits from “secondary” effects: when you reuse memory, the chances are much higher that it is cached already, and cache-misses are often the biggest slow-down of current applications. - total amount of memory allocated, ignoring deallocations: Not so useful, but sometimes interesting and nicely accompanies the call count data to find temporary memory allocations
- leaked memory: Even without the fancy analysis of Valgrind’s
memchecktool to distinguish between still reachable, possible and definitely lost memory, heaptrack can give you a quick look at what memory has not been freed when the debugee stopped. - histogram of allocation sizes over the number of calls: So far one can only
- …: Your ideas are welcome - I’m confident that many more insights can be found from heaptracks data.
NOTE: Just like other profilers and tools, heaptrack relies on the DWARF debug information in your application. If you try to analyze a stripped release build without debug symbols, you’ll have a hard time making sense of it.
Using heaptrack_print
Assume we have run heaptrack on an application and now want to evaluate the obtained data. heaptrack_print is the tool to do that, but it’s relatively cumbersome to use (plain ASCII output, not even an ncurses GUI!). Thus, I explain the output here, such that you can make sense of it. Do take a look at the --help output as well.
Calls to Allocation Functions
Enabled by default, disable via -a / --print-allocators 0.
The output below the MOST CALLS TO ALLOCATION FUNCTIONS header is a list of the top 10 locations that call memory allocation functions. The format, by default, is merged, e.g., for code similar to this:
    void asdf() { new int; }
    void bar() { asdf(); }
    void laaa() { bar(); asdf(); }
will produce output like this, when laa() is called ten times from main():
    MOST CALLS TO ALLOCATION FUNCTIONS
    11 calls to allocation functions with 44B peak consumption from
    asdf()
      at /ssd/milian/projects/kde4/heaptrack/tests/test.cpp:24
      in /ssd/milian/projects/.build/kde4/heaptrack/tests/test_cpp
      10 calls with 40B peak consumption from:
        bar()
          at /ssd/milian/projects/kde4/heaptrack/tests/test.cpp:36
          in /ssd/milian/projects/.build/kde4/heaptrack/tests/test_cpp
        laaa()
          at /ssd/milian/projects/kde4/heaptrack/tests/test.cpp:41
          in /ssd/milian/projects/.build/kde4/heaptrack/tests/test_cpp
        main
          at /ssd/milian/projects/kde4/heaptrack/tests/test.cpp:103
          in /ssd/milian/projects/.build/kde4/heaptrack/tests/test_cpp
      1 calls with 4B peak consumption from:
        bar()
          at /ssd/milian/projects/kde4/heaptrack/tests/test.cpp:36
          in /ssd/milian/projects/.build/kde4/heaptrack/tests/test_cpp
        laaa()
          at /ssd/milian/projects/kde4/heaptrack/tests/test.cpp:41
          in /ssd/milian/projects/.build/kde4/heaptrack/tests/test_cpp
        main
          at /ssd/milian/projects/kde4/heaptrack/tests/test.cpp:105
          in /ssd/milian/projects/.build/kde4/heaptrack/tests/test_cpp
    ...
Here, the backtraces are merged on the location of the new int allocation in asdf(), and all sub-traces are displayed beneath. Since heaptrack_print sorts the data, you can just read its output from the top to find the top 10 hotspots of allocation functions. You can disable backtrace merging with -m / --merge-backtraces 0.
Peak Memory Consumption
Enabled by default, disable with -p / --print-peaks 0.
To decrease your memory consumption, you need to decrease the peak memory consumption. Under the PEAK MEMORY CONSUMERS caption, heaptrack_print shows the top ten hotspots, sorted by the peak size in bytes. This can look e.g. like this:
    PEAK MEMORY CONSUMERS
    3.98MB peak memory consumed over 37473 calls from
    QString::realloc(int)
      in /usr/lib/libQtCore.so.4
      1.04MB over 4 calls from:
        QString::append(QString const&)
          in /usr/lib/libQtCore.so.4
        0x7fa9ce54bf73
          in /usr/lib/libQtCore.so.4
        0x7fa9ce54c5ee
          in /usr/lib/libQtCore.so.4
        QTextStream::readAll()
          in /usr/lib/libQtCore.so.4
        Kate::Script::readFile(QString const&, QString&)
          at /ssd/milian/projects/kde4/kate/part/script/katescripthelpers.cpp:82
          in /ssd/milian/projects/compiled/kde4/lib/libkatepartinterfaces.so.4
        Kate::Script::require(QScriptContext*, QScriptEngine*)
          at /ssd/milian/projects/kde4/kate/part/script/katescripthelpers.cpp:289
          in /ssd/milian/projects/compiled/kde4/lib/libkatepartinterfaces.so.4
        0x7fa9bac7d228
          in /usr/lib/libQtScript.so.4
        ...
Massif Compatibility
Pass a file path to -M / --print-massif. Tune output with --massif-threshold and --massif-detailed-freq.
heaptrack_print, since yesterday, also supports converting the heaptrack data to the Massif file format. This can then be visualized with my Massif-Visualizer. The resulting files are relatively large as much more detailed snapshots are included. I optimized the visualizer a bit as well to speed up the evaluation of these files. It is worth it though! Since the time axis uses real time, it is much easier to correlate to the actual runtime behavior of your application (note: you can configure Massif to also use “real time”, but due to its high overhead, the results are still confusing and not much different to the instruction count). The higher level of detail also makes it simpler to interpret the results. Note though, that the converter currently has no code to ensure the peak is not missed, which can be seen in the images below. I plan to add this eventually.
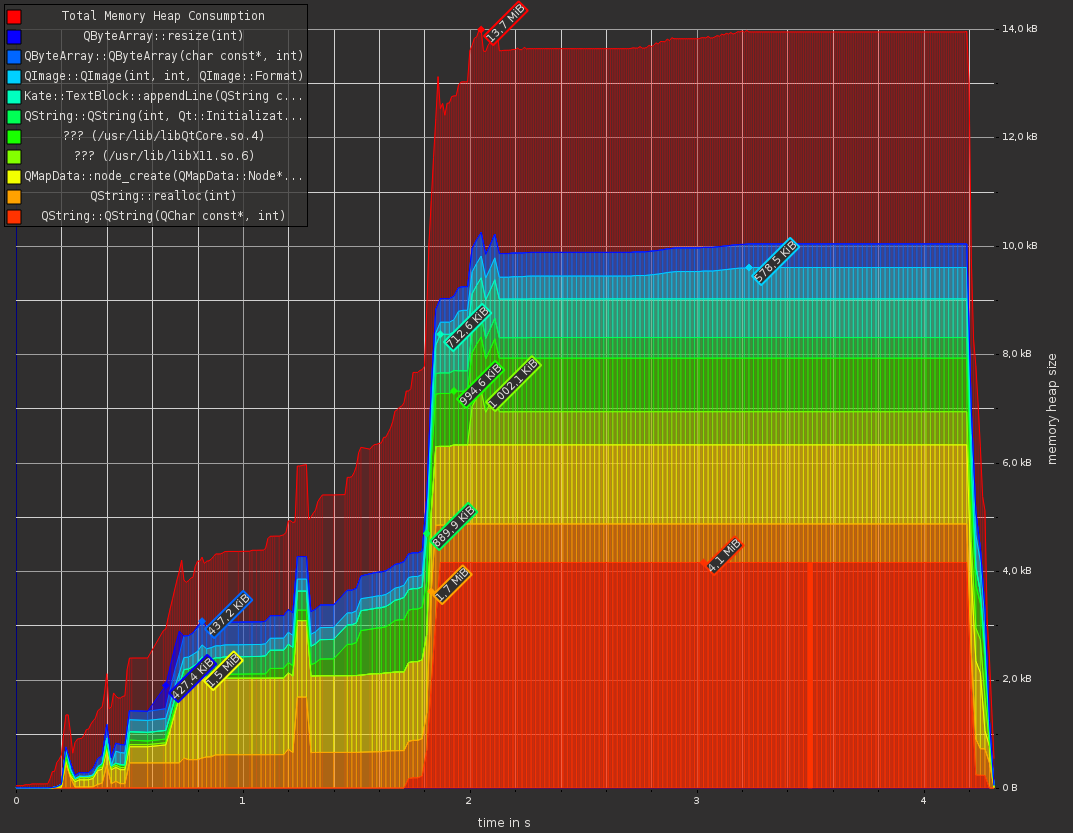
heaptrack

Massif
Comparison of heaptrack and Massif on the same work load shows the much higher level of detail. Overall, the results are compatible, but note that heaptrack uses real time whereas Massif defaults to instruction count for the abscissa time axis. Also, the Massif file generated by heaptrack currently misses the peak, which is accurately tracked by Massif.
Memory Leaks
Disabled by default, enable with -l, --print-leaks 1.
The leaks reported by heaptrack are simply all calls to malloc & friends which where never free‘ed afterwards. It is not possible to do a “still reachable” or “possibly lost” analysis as Valgrind’s memcheck tool does. Still, it is often quite helpful. Note though that it does not support suppression files, which is crucial here as otherwise you’ll often see leaks reported inside libc and other external libraries which are often intentional.
Size Histogram
Disabled by default, enable by passing an output file to -H, --print-histogram.
The size histogram gives an insight into whether you potentially could benefit from a pool allocator or similar optimization technique. heaptrack_print just writes the raw data to the output file you specify. With octave or gnuplot, you can then evaluate this manually, yielding a graph such as the following:

Note how many allocations below 8 byte are done by this application. All of these waste memory space, as the value itself could easily be stored in the space required for a single pointer on a 64 bit machine. For those interested, most of these allocations come from small strings, since Qt’s QString class has no small-string optimization (yet, planned for Qt 6). In the future, the heaptrack data could be analyzed such that it directly points you to the culprits of such memory wastes.
Try it out
So far, I developed this tool mostly to scratch my own itch. I demoed it to some colleagues, but until yesterday, some essential features where missing. Now, I think, it is ready for a wider audience. If you are interested, try it out - I’m interested in your feedback:
    git clone git://anongit.kde.org/heaptrack
    cd heaptrack
    mkdir build
    cd build
    cmake -DCMAKE_BUILD_TYPE=RelWithDebInfo ..
    make install
This should be all that is required to get heaptrack up and running. It depends on Boost (for heaptrack_print and heaptrack_interpret) and a recent libunwind (for libheaptrack.so). If in doubt, compile libunwind also from source, as I fixed one significant performance issue there on my platform. Thus, if heaptrack is extremely slow, please try to update libunwind first. Also note that I have another patch for libunwind in the pipeline to increase the DWARF cache, which improves the runtime performance of heaptrack even futher.
Furthermore I took the liberty of leveraging C++11 features wherever I needed it. You will need a recent compiler to build heaptrack. CMake should tell you if your compiler is too old.
Also note again that this tool currently only works on Linux. With some work, it might be able to port it to other Unixoid platforms. Personally, I won’t spent time on this, as it is not worth it for me. I develop cross-platform Qt applications, and can thus easily investigate the memory consumption on a Linux host.
Platform wise, I build and tested this code only on X86-64 platforms. I hope it also works fine on 32Bit x86, as well as ARM, but I’ll have to test it.
A note on Performance
CPU Overhead
I do not have any reliable benchmark, but I still want to share some rough estimates on the overhead of heaptrack and compare it with Massif. In heaptrakcs source tree, you can find e.g. tests/threaded.cpp, which allocates and frees memory repeatedly and in parallel with multiple threads. With perf stat, we can estimate the worst-case overhead of heaptrack with this test:
Baseline
    $ perf stat -r 5 ./tests/threaded

    Performance counter stats for './tests/threaded' (5 runs):

            147.544073      task-clock (msec)         #    1.736 CPUs utilized            ( +-  6.18% )
                  563      context-switches          #    0.004 M/sec                    ( +-  6.12% )
                  735      cpu-migrations            #    0.005 M/sec                    ( +-  0.78% )
                  910      page-faults               #    0.006 M/sec                    ( +-  4.38% )
          235,074,081      cycles                    #    1.593 GHz                      ( +- 10.63% ) [71.15%]
      <not supported>      stalled-cycles-frontend
      <not supported>      stalled-cycles-backend
          156,034,336      instructions              #    0.66  insns per cycle          ( +-  6.64% ) [91.21%]
            35,155,936      branches                  #  238.274 M/sec                    ( +-  3.27% ) [90.29%]
              366,564      branch-misses             #    1.04% of all branches          ( +-  8.44% ) [86.60%]

          0.084972509 seconds time elapsed                                          ( +-  6.20% )
Averaged over five runs, this test finishes in less than 100ms and roughly 150 million instructions are executed.
heaptrack
    $ perf stat -r 5 heaptrack ./tests/threaded

    Performance counter stats for 'heaptrack ./tests/threaded' (5 runs):

          2126.580121      task-clock (msec)         #    2.120 CPUs utilized            ( +-  4.10% )
                60,137      context-switches          #    0.028 M/sec                    ( +- 10.29% )
                4,853      cpu-migrations            #    0.002 M/sec                    ( +-  7.48% )
              106,589      page-faults               #    0.050 M/sec                    ( +-  0.11% )
        5,398,514,290      cycles                    #    2.539 GHz                      ( +-  4.01% ) [55.40%]
      <not supported>      stalled-cycles-frontend
      <not supported>      stalled-cycles-backend
        5,403,905,664      instructions              #    1.00  insns per cycle          ( +-  1.23% ) [87.56%]
        1,154,188,099      branches                  #  542.744 M/sec                    ( +-  1.58% ) [75.83%]
            22,868,779      branch-misses             #    1.98% of all branches          ( +-  4.20% ) [76.43%]

          1.003186573 seconds time elapsed                                          ( +-  2.40% )
With heaptrack, the test application runs considerably slower. According to perf stat, it is approximately ~12 times slower. Furthermore, we are not executing ca. 5.4 billion instructions., have many more page-faults etc. pp.
Massif
    $ perf stat -r 5 valgrind --tool=massif ./tests/threaded

    Performance counter stats for 'valgrind --tool=massif ./tests/threaded' (5 runs):

          2589.948615      task-clock (msec)         #    1.022 CPUs utilized            ( +-  0.21% )
                11,318      context-switches          #    0.004 M/sec                    ( +-  1.23% )
                7,168      cpu-migrations            #    0.003 M/sec                    ( +-  1.73% )
                8,856      page-faults               #    0.003 M/sec                    ( +-  0.18% )
        6,178,853,885      cycles                    #    2.386 GHz                      ( +-  0.19% ) [50.14%]
      <not supported>      stalled-cycles-frontend
      <not supported>      stalled-cycles-backend
        9,692,798,770      instructions              #    1.57  insns per cycle          ( +-  0.69% ) [81.01%]
        2,311,709,276      branches                  #  892.570 M/sec                    ( +-  0.26% ) [77.11%]
            29,323,133      branch-misses             #    1.27% of all branches          ( +-  0.38% ) [77.79%]

          2.534584622 seconds time elapsed                                          ( +-  0.27% )
With Massif, the situation is even worse. It synchronizes all threads, as evidenced by the task-clock report which shows that only once CPU is utilized. Overall, it is roughly 2.5 times slower than heaptrack and also executes nearly twice as many instructions.
This result is quite promising in favor of heaptrack. In many other tests, the test applications also feel much more fluent when running under heaptrack compared to Massif. But YMMV and take this with a grain of salt.
Memory Overhead
Be also aware that heaptrack not only slows down your application, but also adds a considerable memory overhead, both in-process (libheaptrack.so) as well as out-of-process (heaptrack_interpret). In a non-scientific measurement of the memory consumption of kwrite showing a medium sized text file, I acquired the following numbers for the total memory used after the file is loaded:
- Baseline: 26.1MB
- heaptrack: 39.3MB + 19.2MB = 58.5MB
- Massif: 264.9MB
So again, heaptrack seems to be significantly leaner compared to Massif, but YMMV.
What’s left to do?
I will probably not spent much more time on heaptrack in the coming months, but rather hope to finally be able to concentrate on finishing my studies. Mid-term next year, after a long vacation, I then plan to start working on the following (if noone beat me to it until then):
- do a proper release: I plan to move this tool to KDE’s extragear and undergo a code review. Once that is settled, I will release a first version and hope for packagers to distribute it.
- heaptrack-gui: Generating
massif.outfiles and looking at them in my Massif-Visualizer is nice, but inefficient and only shows a fraction of the data we have available. Thus, a proper GUI application is required to show all of the data in a heaptrack output file. Additionally, it could visualize the data as it comes in, giving you the ability to track the heap behavior of your application in real-time! - public API: heaptrack does not support custom allocators yet. To support this, a simple API could be added similar to Valgrind’s Client Request API.
- I/O profiling etc.: The technique used for heap profiling can also be used to profile I/O, mutex lock contention and more.
Note that stack memory consumption cannot be profiled in this way. Use Massif for that, if you need to look at that.
Reinventing the Wheel
Initially, I thought heaptrack is unique in what it does. Over the time I realized that this is not quite the case. Google’s gperftools has a similar tool, and there is libmemusage.so and many others like it. Thankfully, none of them gives as much data as heaptrack, while still being efficient. So my time was not wasted. And I learned a ton in the process. I invite everyone to inspect my code and give suggestions. It is so far only about ~1.6kloc of code, but probably a bit lacking on the documentation side. I’ll improve this over time, I hope.
I also tried to implement this tool with perf probe, but could not get it to work reliably. The perf script support is still lacking the ability to run native code, which is crucial here to get high performance. Additionally, perf requires root access in order to use user-space probes on e.g. malloc and friends in libc.so. This is not practicable - heaptrack and LD_PRELOAD work as-is just fine.
Thanks
To wrap up this lengthy blog post, I want to express my deepest gratitude again to all those who made this tool possible. In no particular order:
- Julian Seward and the Valgrind team: This tool suite will always remain invaluable to me. Without it, I’d never been able to cross-check the results of heaptrack reliably. For me, while I’ll probably use Massif less and less, I will still be use it to verify that the results obtained by heaptrack are correct. And the error-checking tools in the Valgrind suite, like
memcheck,helgrindordrdare still unmatched in their quality. - Michael Sartain, Peter Lohrman and Valve: Without the code in vogl, I’d still be out on the hunt for an efficient scheme to obtain backtraces, or would be clueless how to translate the instruction pointer addresses with DWARF debug symbols.
- Arun Sharma, Lassi Tuura and the
libunwindteam: The core tool to actually get the backtrace. Many thanks for this fast, easy-to-use library! - GCC team: Not only an excellent compiler, but also the source of the
libbacktracelibrary, which does the heave ELF/DWARF heavy lifting to translate raw instruction pointer addresses. - My colleagues at KDAB: Fruitful discussions with them lead to the solution for many of my problems over the last months. And thanks to the pre-alpha testing!
- all future contributors: Patches welcome! :)
UPDATE 09/12/14: Please use the new, official, heaptrack repository at git://anongit.kde.org/heaptrack. My scratch repository has been updated to notify users about this change. UPDATE 10/12/14: Updated memory “benchmark” data, to reflect recent changes in heaptrack_interpret leading to significantly lower memory overhead.
Comments
Want to comment? Send me an email!
Comment by Anonymous (2017-10-20 03:08:00)
Hi,
Attaching heaptrack to a running process doesn’t seem to work. It always fails with the error:
No symbol “heaptrack_inject” in current context.
If I run the commands directly from gdb (after attaching it to the running process), I get:
(gdb) sharedlibrary libheaptrack_inject No loaded shared libraries match the pattern `libheaptrack_inject’.
This is after it has passed the check :
LIBHEAPTRACK_INJECT=”$EXE_PATH/$LIB_REL_PATH/libheaptrack_inject.so” if [ ! -f “$LIBHEAPTRACK_INJECT” ]; then echo “Could not find heaptrack inject library $LIBHEAPTRACK_INJECT” exit 1 fi
Do you know what is going wrong?
Comment by Milian Wolff (2017-10-20 13:57:00)
Seems like your setup is broken, apparently the path
LIBHEAPTRACK_INJECTis not pointing to the correct location, or the library was not installed properly? Print it and figure out why that path is broken, or the file is missing.Also note that the
sharedlibrary libheaptrack_injectcall is failing because it wasn’t loaded properly before, probably due to the same issue above.Comment by Anonymous (2017-02-22 19:18:00)
No legends in the chart ?!?
I’m seeing nice charts like in the massif visualizer, however there are no legends of whats being displayed. Have I missed something?
Comment by Milian Wolff (2017-02-22 19:23:00)
This feature has not yet been implemented. Note that tooltips exist though as a stopgap solution until I get the time to add proper interaction with the charts (like time-slice filtering, legends, …)
Comment by Anonymous (2017-02-23 14:44:00)
Thanks for mentioning the tooltip information.
Ive been observing some “ in ??”. With valgrind these functions seem to be resolved (i.e. I know which are they). And then some of these functions are shown quite differently with massif-visualize (interleaving within each other) ?
Is there a way to show even more details, then now are displayed (e.g. Caller and Callee information, i.e. who has called what) ?
Comment by Milian Wolff (2017-02-23 15:40:00)
Can you report this issue about the unresolved functions on the bug tracker please? https://bugs.kde.org/enter_bug.cgi?product=Heaptrack If you want me to fix it eventually, you will have to provide me a way to reproduce the issue though. Also, if possible, attach the heaptrack and massif reports so I can see what you are seeing.
Current builds of the GUI from the 1.0/master branches show you all that is implemented so far. Adding lists of callers and callees to the caller/callee model is on my TODO, but not yet done.
Comment by Anonymous (2017-02-22 17:06:00)
Ubuntu Xenial 16.04, kdiagram-2.6.0 $ heaptrack_gui “/home/Qt_5_5_1_GCC_64bit/heaptrack.app.6011.gz” …
heaptrack_gui: error while loading shared libraries: libKChart.so.2: cannot open shared object file: No such file or directory
Comment by Anonymous (2017-02-22 18:09:00)
I made clean install of both kdiagram, and heaptrack. This time it didnt show any error.
By the previos installation I used checkinstall 1.6.2-4, instead of make install … Maybe this was the root cause.
Comment by Anonymous (2017-02-22 14:31:00)
$ make install …
heaptrack/src/analyze/gui/mainwindow.cpp:399:76: error: cannot convert ‘void (MainWindow:: )()’ to ‘const char ’ for argument ‘2’ to ‘QAction* KStandardAction::open(const QObject , const char , QObject*)’ m_openAction = KStandardAction::open(this, &MainWindow::closeFile, this); ^
Comment by Milian Wolff (2017-02-22 14:40:00)
Fixed, please pull again
Comment by Anonymous (2017-02-22 15:10:00)
The commit worked. Now is time to test heaptrack ;)
Comment by Anonymous (2017-02-22 12:46:00)
Hello, System: xenial 16.04
$ make install … heaptrack/build/src/analyze/gui/ui_mainwindow.h:41:27: fatal error: kurlrequester.h: No such file or directory ..
cmake file updated ? (Solution : Install kio-dev)
Comment by Milian Wolff (2017-02-22 12:48:00)
Yep, see: https://userbase.kde.org/Heaptrack/Build/Ubuntu_16.04
Also, the CMake file checks for KIO already, so I don’t understand why it passed this check for you.
Comment by Anonymous (2017-01-09 11:21:00)
Hello,
I ran this tool on my application but it don’t progress as soon as I ran it got hang even it don’t go inside the main for execution. Can you please provide some help.
Comment by Anonymous (2017-01-09 13:39:00)
0 0x005b97a2 in _dl_sysinfo_int80 () from /lib/ld-linux.so.2
1 0x001e6a9e in __lll_mutex_lock_wait () from /lib/tls/libc.so.6
2 0x0013b727 in _L_mutex_lock_31 () from /lib/tls/libc.so.6
3 0xbfec1408 in ?? ()
4 0x00238ff4 in ?? () from /lib/tls/libc.so.6
5 0x00000000 in ?? ()
This are some initial back-trace i will soon create test app and submit the bug.
Comment by Milian Wolff (2017-01-09 12:33:00)
Please report a bug on bugs.kde.org (use the heaptrack component). Make sure to supply a reproducible test case for me (e.g. your application). Also get a backtrace when it hangs by attaching GDB to your application and obtaining a backtrace then.
Comment by Anonymous (2016-12-13 05:17:00)
Hi ,I tried heaptrack on Ubuntu platform, it’s wonderful. How can I build it for Android platform ? Is that possible? Thanks.
Comment by Milian Wolff (2017-01-09 00:15:00)
I have not enough experience on Android. I’ll have to try it out and see if it’s possible at all.
Comment by Anonymous (2016-12-07 23:44:00)
Saw some lighting talks and it looks promising. I really like the idea of being able to see the charts in realtime.
Unfortunately I struggled for several hours trying to compile and now I have just realised that I haven’t got the gui compiled. Importing data in massif visualizer is too much.
Anyway not wanting to sound critical but it would be great to have a simple install procedure like a ppa and clearer document explaining the different parts so it’ easier to get started.
Comment by Milian Wolff (2017-01-09 00:16:00)
I have now extended the
README.mddocumentation and made the dependency on KChart optional. Additionally, I’ll try to make an official first release this week, which should bring heaptrack into various distributions official packages then.Cheers
Comment by Anonymous (2017-02-07 19:06:00)
My Ubuntu 16.04 instructions are:
sudo apt-get install libdwarf-dev libkf5coreaddons-dev libkf5i18n-dev libkf5itemmodels-dev libkf5threadweaver-dev libkf5configwidgets-dev libkf5kiocore5 libkf5kiowidgets5 kio-dev libsparsehash-dev libqt5svg5-dev extra-cmake-modulesInstall kdiagram from source (clone and follow standard cmake instructions.
sudo make installat the end)Clone heaptrack from github
Edit
analyze/gui/mainwindow.cppline 83 or so, thenew QActioncall needs a NULL 3rd argument to be compatible with the headers installed by apt as aboveBuild heaptrack and check for any warnings or missing packages during the
cmakestep. Check that theheaptrack_guiexecutable is createdComment by Milian Wolff (2017-02-21 10:13:00)
Thank you,
I have now started a Heaptrack page on KDE’s userbase wiki, to document the build setup. See: https://userbase.kde.org/Heaptrack and https://userbase.kde.org/Heaptrack/Build/Ubuntu_16.04 . Please extend this as needed, and do include other distros as well!
Comment by Anonymous (2017-02-07 19:09:00)
Not sure how I replied to the wrong comment. See below.
Comment by Anonymous (2016-10-25 18:10:00)
Millian, First, thanks for the great work on this and massif-visualizer.
Not sure if it’s obvious to everyone what the dependent packages and libraries are, and where to get them, but it took me on and off most of yesterday to figure out how to build the gui. But now that the gui is built, I must say it’s worth the time, especially since my program has significant amount of heap usage.
WARNING - personal rant below. I didn’t know what ECM was (confusion with ecm CD image compression tool); I had to track down the Qt and KF dependencies one by one through the ubuntu apt repos; I missed he piece of information about KChart being called kdiagram now and it not being part of KDE office, and KDE office not being part of ubuntu repos even for kubuntu.
I would like to request either 1. a ubuntu package for heaptrack or a ppa, or 2. clear, step by step installation instruction and list of prerequisites.
A longer term “nice to have” would be to remove the kdiagram dependency - seems a significant requirement to have to install significant KF5 and KDE modules just to get charting, especially for a gnome user…
In the interest of saving future user’s time, below are the dependencies I found when trying to compile this on ubuntu 16.04. It might be useful for the ubuntu 16.04 installation instruction.
Thanks!
Tony
ECM = “extra cmake modules” in ubuntu synaptic. ubuntu 16.04 has ECM 5.18.0 cmake 2.8.9 or newer (but with ECM from ubuntu 16.04, heaptrack CMakeLists.txt need to be updated to require cmake 2.8.12 else FindKF5.cmake fails). libunwind: search in in ubuntu repo Boost version 1.41.0: search for libboost-program-options and libboost-iostreams. I used both the binary and -dev packages. QT 5.2.0: “Qtbase5-dev” ubuntu package. KF5: ubuntu packages = qtdeclarative4-kqtquickcharts, libkf5coreaddons-dev, libkf5i18n-dev, libkf5itemmodels-dev, libkf5threadweaver-dev, libkf5configwidgets-dev, kio-dev
KCharts 2.6.0 + from - https://github.com/KDE/kdiagram.git requires package ubuntu packages libqt5svg5-dev
Comment by Milian Wolff (2017-01-09 00:38:00)
Hey,
I just added more information to the top-level README.md, see e.g.: https://github.com/kde/heaptrack
I also made the dependency on KChart optional, but Qt5 and KF5 is still required for
heaptrack_gui.And as mentioned above, I’ll finally try to get a proper release out of the door, which should bring heaptrack as a package to various distributions out there.
Cheers
Comment by Anonymous (2017-02-07 19:08:00)
My Ubuntu 16.04 instructions are:
sudo apt-get install libdwarf-dev libkf5coreaddons-dev libkf5i18n-dev libkf5itemmodels-dev libkf5threadweaver-dev libkf5configwidgets-dev libkf5kiocore5 libkf5kiowidgets5 kio-dev libsparsehash-dev libqt5svg5-dev extra-cmake-modulesInstall kdiagram from source (clone and follow standard cmake instructions.
sudo make installat the end)Clone heaptrack from github
Edit
analyze/gui/mainwindow.cppline 83 or so, thenew QActioncall needs a NULL 3rd argument to be compatible with the headers installed by apt as aboveBuild heaptrack and check for any warnings or missing packages during the
cmakestep. Check that theheaptrack_guiexecutable is createdComment by Anonymous (2017-10-03 20:56:00)
Hello,
I tried as you suggested on my Ubuntu 16.04.3 LTS system and was unable to get the kdiagram component to build. Something about the Qt5 library being ‘too old’ a version.
Comment by Milian Wolff (2017-10-16 10:34:00)
Read the message, your Qt is too old. We now depend on Qt 5.6 or higher. Also, you should probably update your ECM.
Note that the next release will also include an AppImage of heaptrack. Stay tuned, if you don’t want to update Qt/ECM via backport repos.
Comment by Anonymous (2016-10-23 12:46:00)
Thanks for your great work
i compiled heaptrack under Ubuntu 14.04.4
but when i try inject into running process
gdb returns:
if i try attach to process over gdb
i get following error message:
How i can resolve this behavior of gdb ?
Comment by Milian Wolff (2017-01-09 00:36:00)
This sounds like you are trying to attach to an application that does not link against
libdl. I just found https://github.com/gaffe23/linux-inject which uses the internal__libc_dlopen_modesymbol instead. Sounds like a good alternative to my approach currently, I have just pushed a commit that fixes this. Can you try again?Thanks
Comment by Anonymous (2016-09-24 14:38:00)
Hi
I am getting following error at time of building massif-visualizer on rhel 7 . this issue is coming on every version when i am trying to build it from source file at make.
[ 89%] Built target massif-visualizer_automoc Linking CXX executable massif-visualizer /usr/lib/libkdeui.so.5.10.5: could not read symbols: File in wrong format collect2: error: ld returned 1 exit status make[2]: ** [app/massif-visualizer] Error 1 make[1]: ** [app/CMakeFiles/massif-visualizer.dir/all] Error 2 make: *** [all] Error 2
Thanks Anjan
Comment by Anonymous (2016-08-18 14:54:00)
Hi
Thanks for the post. It seems that the git server is not working. git://anongit.kde.org/heaptrack Andreas
Comment by Milian Wolff (2016-08-18 14:55:00)
Either try again later, or use the github mirror: https://github.com/KDE/heaptrack
Comment by Anonymous (2016-08-17 23:06:00)
Does anything special need to be done for a program that uses tcmalloc?
Comment by Anonymous (2016-08-17 23:22:00)
The code in my library uses new and I didn’t see any new call being reported by heaptrack. But I also use a third party library which uses malloc - and all calls to malloc were reported.
Comment by Milian Wolff (2016-08-17 23:29:00)
How does tcmalloc intercept operator new? In my tests with the system malloc, operator new still calls malloc internally. If that is not happening for tcmalloc, something else must be found to make it work.
I suggest you set a breakpoint before an operator new in a tcmalloc application and then step to follow along the instructions that get executed. That should give us a picture to figure out what would be necessary here.
Comment by Milian Wolff (2016-08-17 23:09:00)
I haven’t tried it, but I don’t think you need to do anything special as long as you still use malloc + free. If you on the other hand use some kind of tcmalloc special API directly, then heaptrack won’t intercept these calls.
Comment by Anonymous (2016-08-15 21:23:00)
I cloned the git repo and followed steps 1-5. At step 5, when I do
geshi:code|cmake -DCMAKE_BUILD_TYPE=RelWithDebInfo ..|codeI get the following error:
CMake Error at 3rdparty/libbacktrace/CMakeLists.txt:163 (message): Could not find dwarf.h, try installing the elfutils development package.
— Configuring incomplete, errors occurred!
I then did:
geshi:code|sudo apt-get install elfutils|code, followed bygeshi:code|rm -f *|codein the build directory.and executed
geshi:code|cmake -DCMAKE_BUILD_TYPE=RelWithDebInfo ..|codeagain. Result is still the same :(.I am running Ubuntu 14.04.4 LTS.
Comment by Milian Wolff (2016-08-16 10:07:00)
Try to look for a file called dwarf.h, e.g. at http://packages.ubuntu.com/search?searchon=contents&keywords=dwarf.h&mod…
Then install libdwarf-dev, and you should be good to go. I’ll add that info to the cmake error message.
Cheers
Comment by Anonymous (2016-08-17 00:38:00)
Thanks for the quick response. That fixed it!
Comment by Anonymous (2016-06-09 12:55:00)
I really like your visualization with heaptrack_gui. Heaptrack traces the whole amount of memory. But I have allocations and deallocations in a short time interval. Heaptrack_gui did not visualize them as precisely as it would be necessary in my application. Could you provide me a solution for this problem.
Comment by Milian Wolff (2016-06-09 13:06:00)
Can you clarify your problem, maybe by pasting an example source file that reproduces your issue to a source code hoster? Then please explain me what you are seeing and how you would like to see it instead.
Do you want to zoom in (and filter on) a selectable time frame? This is not yet implemented, but high up on my todo list. Please stay tuned.
Then, when you say “in a short time interval” - do you have trouble with the 1ms time resolution in heaptrack? Would it be enough to be able to zoom in and then show the evolution of the heap memory in that time frame assuming monotonic increasing time? This should be doable, but we first need the normal zoom/filter functionality above implemented. Once we have that, adding such a feature could be doable, but I don’t want to output a timestamp together with every allocation/deallocation, as that would drastically increase the size of the output file and also increases the heaptrack overhead considerably.
We could also think about making the time resolution configurable, which sounds like a good idea in general… I’ll think about that
Comment by Anonymous (2016-06-09 14:57:00)
Thank you for your answer. Please see the attached code example. It underlines the existing problem. I want to see the first peek of the consumed memory, like I can see if I uncomment the breaks. It seems to be similar to your question. I have problems with the 1ms time resolution of heaptrack_gui. Is it possible to modify the resolution of heaptrack_gui? I think heaptrack tracks the whole memory usage, independent from the time intervall of the allocations in this example.
Comment by Milian Wolff (2016-06-09 15:07:00)
OK, got it. Resolving this graphically is not implemented yet, but doable. As I said above: While all allocations are traced, they are not directly correlated to a timestamp, but rather a timestamp is outputted regularly (every 1ms). The allocations in that region are aggregated and only the peak is reported. In your case you’ll see the two allocations of 512 Bytes, but the graphs don’t show the saw-pattern for that as the time resolution is not fine-grained enough. Personally, I did not need such high-resolution graphs yet, which is why I haven’t yet implemented this - the total peak is much more interesting to me, and that is accurately resembled in the graphs.
Stay tuned, eventually we can get there. If you really really need this now then you’ll have to hack libheaptrack.cpp to call
writeTimestamp()fromhandle{Malloc,Free}()before they write their output, but you’ll also need to changewriteTimestamp()to increase the time resolution to nanoseconds or similar. You should then be able to load the generated (and much bigger) output file intoheaptrack_gui, I think. Note that the time resolution change of course needs to be changed there as well, see e.g.TimeAxis::customizedLabel, which currently divdes by 1000 to convert ms to s.Comment by Anonymous (2016-04-26 17:24:00)
Having trouble building
CMake Error at /usr/lib64/boost/Boost.cmake:536 (message): The imported target “boost_date_time-static” references the file
but this file does not exist. Possible reasons include:
The file was deleted, renamed, or moved to another location.
An install or uninstall procedure did not complete successfully.
The installation package was faulty and contained
“/usr/lib64/boost/Boost.cmake”
but not all the files it references.
Call Stack (most recent call first): /usr/lib64/boost/BoostConfig.cmake:28 (include) /opt/cmake/cmake-3.5.2-Linux-x86_64/share/cmake-3.5/Modules/FindBoost.cmake:245 (find_package) CMakeLists.txt:16 (find_package)
Comment by Milian Wolff (2016-04-28 11:34:00)
What distro is that? Sounds like a setup issue with CMake / Boost on your system - completely unrelated to heaptrack itself.
Comment by Anonymous (2016-04-26 15:13:00)
Looking forward to trying this out but I cannot get your project:
$ git clone git://anongit.kde.org/heaptrack Initialized empty Git repository in /opt/heaptrack/.git/ anongit.kde.org[0: 31.216.41.69]: errno=Connection timed out anongit.kde.org[0: 5.39.11.196]: errno=Connection timed out fatal: unable to connect a socket (Connection timed out)
Comment by Milian Wolff (2016-04-26 15:15:00)
Odd,
sounds like a temporary network glitch, maybe in one of the KDE git mirrors. Please try again. I just tested it and it does work for me right now… Worst-case you can also refer to the Github mirror at https://github.com/kde/heaptrack
Comment by Anonymous (2016-04-26 15:41:00)
thank you https worked fine…likely a firewall issue - am inside my companies network
Comment by Anonymous (2016-02-25 12:52:00)
I really enjoy using heaptrack, thanks a lot for it! I am currently looking at “memory leak” problems where the memory is actually wrapped safely in shared_ptrs but somehow the shared_ptrs never go out of scope and thus the memory is not freed. Is it possible to find out which reference is still around using heaptrack somehow? By exchanging ref/deref functions?
Comment by Milian Wolff (2016-02-25 13:33:00)
Thanks for the feedback!
But I’m afraid to tell you that currently I have no plan how to extend heaptrack to track reference counting bugs. I completely agree that it would be really nice to have in, but I think it would need a separate tool, or a separate view in the gui, to display these issues. And of course first we must get the data… Overloading C++ symbols via
LD_PRELOADis possible 1, albeit ugly, and also only works for non-inline exported symbols afaik. None of this is probably true for theshared_ptrrefing code… What would be possible of course is to custom-patch the STL header to call an extern C function for every ref/deref, then hijack that in heaptrack. It’s doable, but lots of work of course.If you are interested , I’d certainly be available to mentor you to write a
reftracktool which leverages a large part of the existing heaptrack code to grep backtraces etc. pp.Comment by Anonymous (2016-02-25 14:37:00)
I could probably use template specialization or the fact that all shared pointers shared_ptr are actually typedef as fooPtr in this code to trigger some special function as well. But there is no easy way to request a stacktrace dump from heaptrack I guess?
Comment by Milian Wolff (2016-02-25 17:34:00)
if you just want to (ab)use the existing code, you’d have to do the following:
libheatrack.sowhich only wrapslibheaptrack.{cpp,h}heaptrack_init(see existing code for the preload and inject libs for how to do that). essentially you just want to give it a file name where to write the result file toheaptrack_mallocandheaptrack_freefor every ref/deref in your codethen pipe the result file through
heaptrack_interpretand save the final result, e.g. something likebeware: the result file can be quite large. if that is an issue, adapt
heaptrack.sh.cmaketo your needs. It does the above on-the-fly to save disk space.reftrack.gzinheaptrack_guiIf you need more help, let us please continue this discussion via email (blog comments are tedious imo). You can reach me via mail@milianw.de.
Thanks!
Comment by Anonymous (2016-02-05 17:45:00)
I have a program that allocates space for large data sets processes them and deletes them. It also keeps some small amount of data in memory about files that have been processed. What I think is happening is that some of the meta data is being allocated at the top of the heap which means that when the large data sets are deleted the heap cannot shrink.
Does HeapTrack (or any other heap analysis tool) have the ability to help me find which allocations are at the top of the heap and preventing freed memory being returned to the system?
Comment by Milian Wolff (2016-02-05 17:52:00)
One could add such features, but as of now, no - heaptrack won’t easily answer this question. I do hope to add this capability in the future though, but it may be a bit problematic to access the data about loaded pages efficiently, maybe parsing
/proc/<pid>/smapsfor every timestamp or some such…. Anyhow, some notes to your problem, or how I understand it:a) Most
mallocimplementations will use separate pages for large allocations and keep small allocations out of such regions. Thus once the large area is freed, it should be handed back to the kernel. If I understood you correctly, you have a pool allocator allocating large chunks, right? Once you freed that large chunk, it should thus be freed again. b) If you have small allocations otoh, and lots of them, you can easily run into https://sourceware.org/bugzilla/show_bug.cgi?id=14827. Can you try to add a call tomalloc_trim(0)to your code - does that have a significant affect? c) If none of this helps, have a look at the output frommalloc_info, it will output metrics about the different arenas, and what it thinks is fragmented etc. pp. That should answer your question.HTH
Comment by Anonymous (2015-12-21 22:34:00)
Is it possible to elaborate compilation of gui part? I have tried to compile it on OpenSuse Leap 42.1, failed miserably while compiling kdiagram, kcoreaddons, ki18n, … etc. dependencies. Also would it be possible to compile gui part on Ubuntu LTS 14.04? Thanks a lot.
Comment by Milian Wolff (2015-12-23 00:39:00)
What exactly are your issues when you compiled the dependencies?
Comment by Anonymous (2015-12-28 10:28:00)
Nevermind, I have managed to run gui part on ubuntu 14.04 LTS! For those whom are interested, here is what i did:
The problem is my distro comes with qt 5.2.1 and I didn’t want to update it myself so i had to checkout a commit before qt 5.3.0 update.
Thanks for this great project, Milian, it already helped me alot. Ali
Comment by Anonymous (2016-03-15 12:13:00)
Here’s the lazy version:
Comment by Anonymous (2015-12-28 10:36:00)
Btw, I did regular cmake & make & make install for above all projects, nothing special. For example:
It would be very good if someone can make a debian package for it. Ali
Comment by Anonymous (2015-11-16 13:52:00)
Hi there!
First of all, great project - looks very promising! Can’t wait to try it. However, I get the following error after building heaptrack on Fedora 18, x86_64 (don’t ask why i’m using F18, not my choice):
“starting application, this might take some time… ERROR: ld.so: object ‘/usr/local/lib/heaptrack/libheaptrack_preload.so.1.0.0’ from LD_PRELOAD cannot be preloaded: ignored.”
Permissions look fine. I’m using Qt 5.5, but don’t think this causes an issue. Any idea what’s wrong?
Comment by Milian Wolff (2015-11-16 14:05:00)
Hm I’ve never seen this issue. My only guess would be that you are mixing ABIs, could you compare the output of
fileon thelibheaptrack_preload.so.1.0.0and on your application binary? Maybe it’s a mixture of 32bit and 64bit?Comment by Anonymous (2015-11-14 16:56:00)
Hi,
Is the —massif option to heaptrack_print supposed to be so slow? I have a 7.2 MB heaptrack .gz output file, and so far heaptrack_print has been chugging on it for 17 minutes and counting. (It seems that judging from the file offset, it’s about 2/3 there.)
Comment by Milian Wolff (2015-11-14 19:10:00)
You can speed it up by increasing the detailed frequency:
Massif’s text format is super inefficient to create. Try heaptrack_gui, which is much faster, if you have access to the KF5 dependencies to build it.
Cheers
Comment by Anonymous (2015-11-15 02:29:00)
heaptrack_gui was much faster, yes. Unfortunately it needed something like 400 MB of KDE dependencies for showing a graph and a tabview :-) And even though load time is no longer measured in hours, it’s still measured in minutes. (I had a run that required 20 minutes or so.)
Perhaps it would be faster if the heaptrack format was in binary instead of requiring repeated regex application for parsing?
Comment by Milian Wolff (2015-11-15 16:09:00)
Hey there,
can you tell me what dependencies make up the 400MB? I wouldn’t expect such a large size impact for the few frameworks I use. Maybe you installed the full KF5/plasma environment? That is not required, only these KF5 packages and their dependencies and devel packages are required:
For the charts you additionally need KDiagram/KChart which also only has minimal Qt 5 dependencies. On Arch, this amounts to less than 200MB, including Qt 5 and its dependencies. Excluding Qt 5, it’s just ~20MB.
Regarding regex parsing: I’m not doing any regular expression parsing anywhere. Why did you think I do that?
Comment by Anonymous (2016-01-06 03:05:00)
KDiagram does not have minimal dependencies at all, really. I installed all the -dev packages I needed to compile it (on Debian); that’s where the 400 MB number comes from. The KF5 packages alone are 40 MB. Then you need Boost, which is 230 MB including all dependencies I didn’t have already… the list goes on. Of course, you are free to use whatever dependencies you want to (it is your software, after all), but it feels overkill for what the GUI actually seems to be doing.
The reason why I think you’re doing regex parsing is that regex functions showed up really high when I profiled heaptrack_gui to figure out what was taking so much time. (This was during one of the really long loads; I don’t have that data around anymore.) Perhaps it’s an indirect call somehow?
Comment by Milian Wolff (2016-01-06 14:21:00)
KDiagram only requires Qt 5 and extra-cmake-modules. It does not require boost. Heaptrack itself does use some boost in a few places, outside of the GUI part that uses Qt 5.
Anyhow, if you have suggestions on how to improve the situation then I’m all ears. But currently, the file size of build dependencies is really of no concern to me.
Regarding regex hotspot: Please show me a callgraph that you got from your profiler. Also feel free to grep both heaptrack and kdiagram for regular expression classes (QRegExp, QRegularExpression) - they are not used. And I’ve profiled heaptrack_gui a lot in order to make it faster - never have I seen regular expressions pop up anywhere, let alone as a hotspot.
Comment by Anonymous (2015-11-15 11:37:00)
Wait, the default is with no optimization? You need to add an incantation (-DCMAKE_BUILD_TYPE=RelWithDebInfo) to get optimization, and it will hide the compile line from you by default unless you give it VERBOSE=1? No wonder there’s cmake hate in the comments…
Comment by Milian Wolff (2015-11-15 15:57:00)
I’ve now pushed a commit that defaults to
RelWithDebInfowhen noCMAKE_BUILD_TYPEis specified.Comment by Anonymous (2015-10-26 04:03:00)
The GUI seems to depend on a bunch of KDE stuff that’s not available for Ubuntu 14.04. Is it feasible to get it working, or should I just learn to love the cli?
Comment by Anonymous (2015-10-26 04:12:00)
Also, to offset some of the negativity in the comments beneath mine: thanks for making a great tool! Yeah, it’s a little tricky to build the GUI, but that should improve with time. I might just use massif until then, but I’d never have known about massif either if it weren’t for you.
Comment by Milian Wolff (2015-10-27 12:48:00)
Note that you can also generate flame graphs with
heaptrack_print. Alternatively, you can push theheaptrack.FOO.PID.tgzfiles to another machine with a more modern Linux distributions where you have access to the required packages to buildheaptrack_gui.Cheers
Comment by Anonymous (2015-10-25 19:38:00)
I don’t know how you managed to build this thing. You require
.cmakefiles for QT5, but Debian does not provide them, not even with theqt5-devpackage. (and not withcmake-dataeither). CMake is a terrible idea. It’s even worse than SCons. Thanks to you, I know never to use it in any of my projects.Comment by Milian Wolff (2015-10-27 12:46:00)
A bit of googling helps: http://askubuntu.com/questions/374755/what-package-do-i-need-to-build-a-… Yes, this also applies to Debian.
Comment by Anonymous (2015-10-25 18:49:00)
You just had to use the absolute latest version of QT instead of just going with QT4. Now, instead of just being able to do “cmake”, I have to spend hours fighting with Aptitude to get QT5 to install without deleting half my system first. Thanks a lot.
Comment by Milian Wolff (2015-10-27 12:47:00)
Exactly, I had to use Qt 5 which is available since 3 years now already. I also had to use it because it’s more fun than Qt 4. And I do this in my free time after all. You are welcome, glad that you like it as much as I do!
Comment by Anonymous (2016-03-28 09:12:00)
Resolving dependencies in Aptitude is NOT fun at all.
And I never was able to build your project, because the file “FindQt5.cmake” apparently only exists on your hard drive and nowhere else, and your project can’t build without it. I came back here because now I’m trying to explain why CMake sucks balls on Reddit.
Comment by Milian Wolff (2016-03-29 16:31:00)
Qt 5 itself ships the required cmake files, but it is not shipping
FindQt5.cmake, but rather aQt5/Qt5Config.cmake. See e.g. the contents ofqtbase5-devon Debian: https://packages.debian.org/search?searchon=contents&keywords=Qt5Config….I’m pretty sure it’s similar on Ubuntu. So instead of blaming “CMake sucks balls”, maybe you should start understanding the tools and how they operate first.
Comment by Anonymous (2015-03-27 03:03:00)
Got it built and running (somewhat)
Recursive hang in libunwind calling malloc (indirectly). Any ideas? On ubuntu 14.04 x64.
Comment by Milian Wolff (2015-04-18 14:02:00)
Do you have more input on how to reproduce this issue? Maybe you can tell me what FOSS project you tried it on?
Comment by Anonymous (2015-03-17 19:12:00)
During installation process I had a problem with building heaptrack_print target (during execution ‘make install’ command) . It looked like multiple errors:
Solution for that was adding in
{heaptrackRoot}/build/CMakeFiles/heaptrack_print.dir/link.txtto build component{boostRoot}/libs/iostreams/src/zlib.cppand {boostRoot}/libs/iostreams/src/gzip.cpp`. Also adding linking zlib library via ‘-lz’ will be necessary.Complete
{heaptrackRoot}/build/CMakeFiles/heaptrack_print.dir/link.txtfile for me looks like:After that ‘make install’ command is executing without errors. I hope above instruction will be useful for someone.
PS. Are you planning to add stack profiling to heaptrack?
Best regards, Rafal
Comment by Anonymous (2015-12-10 15:24:00)
I also had a lot of undefined references in boost libraries and zlib at the step where heaptrack_print is build. My problem was the ABI incompatibility between gcc 5.2 and clang 3.6 in Ubuntu 15.10, as clang was set as default compiler. With gcc as default, set with
and choosing g++, heaptrack compiled flawlessly.
Comment by Milian Wolff (2015-04-18 14:08:00)
This is odd, I explicitly require the boost iostreams component and link against it. And for me
libboost_iostreams.so.1.57.0links dynamically tolibz.so.1already. What distro do you use? What does ldd say for you?Regarding your PS, no stack profiling is out-of-scope for heaptrack. I see no way to achieve this with the current approach. If you need that, use massif from the valgrind suite.
Cheers
Comment by Anonymous (2015-06-30 00:14:00)
problem appears to be with compilation of libsharedprint in CMakeLists.txt.
I did the following and compilation succeeds without having to modify the generated link.txt file as the earlier poster did.
tested on ubuntu 14.04.2, libboost 1.54.0, gcc 4.8.2
tony
Comment by Milian Wolff (2015-07-02 23:19:00)
I’ve added a potential fix - could you test again please?
Comment by Anonymous (2015-06-26 04:18:00)
FWIW, I had the same issue. Also in the new heaptrack_gui I had to do that as well as delete the option for no exceptions… Does heaptrack have a project page?
Comment by Milian Wolff (2015-07-02 23:52:00)
What kind of project page do you have in mind?
Comment by Anonymous (2015-03-03 14:17:00)
Doesn’t compile on armhf, ping me (tsdgeos) when you’re back from holidays if you read this :D
Comment by Anonymous (2014-12-20 09:39:00)
FWIW, there’s also https://github.com/jrfonseca/memtrail but I confess it still has some rough edges. — Jose
Comment by Anonymous (2014-12-19 09:30:00)
Is it working on uCLinux Targets ?
Comment by Milian Wolff (2014-12-19 12:17:00)
I don’t know, try it out!
Comment by Anonymous (2014-12-07 14:32:00)
This is a very interesting project, Milian. Thanks for sharing it!
Comment by Anonymous (2014-12-03 22:48:00)
This is really cool Milian. I’ve been using gperftools for this work right now. Modified it do snapshots when resident size goes up by a specified amount and then take diffs of those - been using this on our TF2 dedicated servers. I will definitely keep an eye on your work with heaptrack though. Thanks much! -Mike (Mike Sartain from Valve)
Comment by Anonymous (2014-12-03 12:32:00)
FYI: jemalloc has a built in statistical heap profiler that adds very little overhead and works well with programs with gigantic heaps. It generates pprof files so you use the same viewer tool as the gperftools. Its fast enough and low enough overhead that it can be turned on in production.
Comment by Milian Wolff (2014-12-03 14:15:00)
Thanks, very interesting! But to quote from https://github.com/jemalloc/jemalloc/wiki/Use-Case:-Heap-Profiling:
So they use sampling to speed up the process. heaptrack could do the same, to speed it up even further. But, imo, its overhead is so low, that we don’t need this. Getting the raw backtrace with libunwind is pretty fast. And since we do the DWARF annotation in a separate process, potentially at a different time, and also delay the actual interpretation of the data, the runtime overhead is small.
I’d be interested to see a comparison between such a sampling based method and heaptrack. Similar to perf or VTune, I assume that the sampling method will also find the hotspots. But it cannot give accurate heap memory measurements, nor hard numbers on the allocation calls or the like. Since with heaptrack we really get all data about heap allocations, we can do all sorts of analyses afterwards, and I’m not sure you can do all of that with the results one obtains from sampling.
Comment by Anonymous (2014-12-02 20:14:00)
W00t… I have long been googling “linux head profiler” to find a tool to investigate ever-growing memory usage in KDE components, but massiv was not able to give me the data I needed (or I was too dumb to interprete them).
Massive thanks! :)